by: Mr. 305
Stock Trader’s Almanac 2020 is a my guide in creating my daily trade bias for Index, ETFs and Futures . For the past 8 months, I was testing how to use the Almanac market probability to my trading. The book it self is full of market information and different probabilities in certain scenarios. The book provides probabilities on how an Index will perform on a given day. Trading is all about probabilities and odds. What is the probability to go up or down in a given month, week, and even day, if you have this information what are you supposed to do? Use it to your advantage.
Eight months ago trading I open the 2019 version and look on S&P 500 and check what is the probability of SPX to go up that day. I was surprised that the Almanac was correct. SPX was bullish and strong, as its show 62% it will go up on that given Monday.
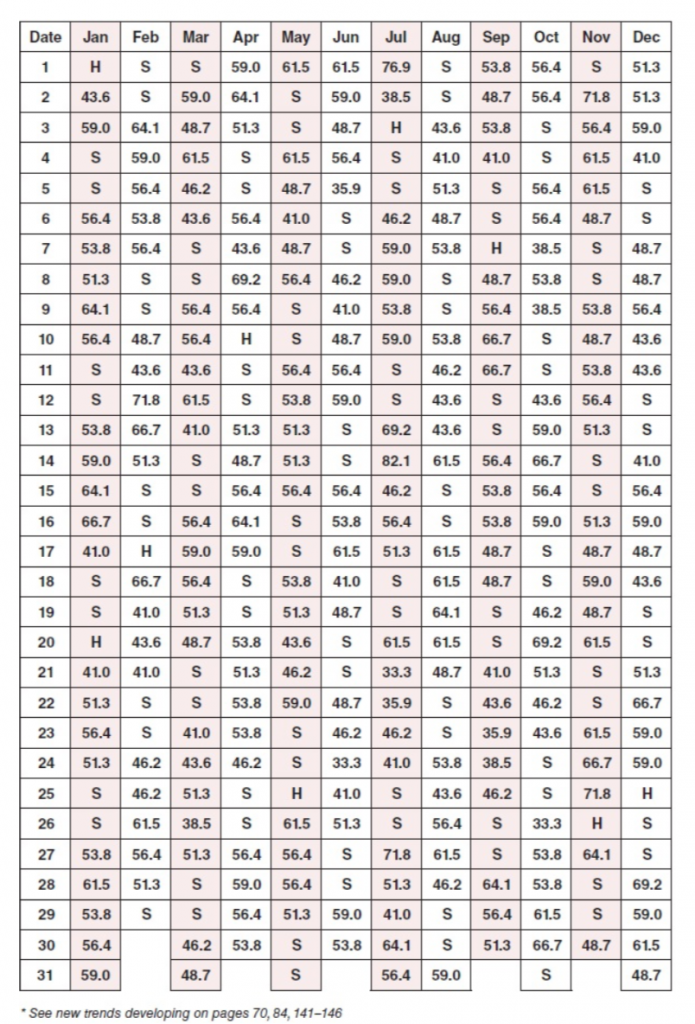
Russell 1000 Index Market Probability Calendar
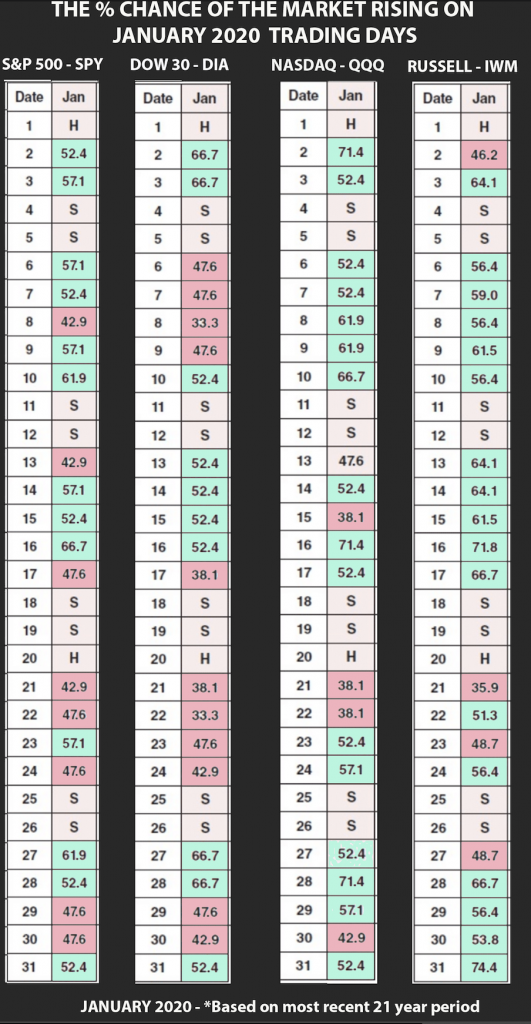
So I did some photoshop and created a version that will show all 4 major US Index and decide now I have a bias where this market go on each day. I marked green for a bullish day and red for bearish. Gonna show you how to use this chart. Look at S&P 500 (SPX) Jan 2, 2020 it is green with 52.4% chances of going up, until Jan 7, 2020. I consider SPX to be very bullish the whole week. Look at Dow (DJI) Jan 6, 2020 it is green with 47.6% chances of going up, until Jan 9, 2020. I consider SPX to be very bearish that week. That is how my bias is made. At times many of the Index don’t align, it’s alright. You just need to follow one Index to trade. I always look on this table first to know how I will play my trades.
Ok we have now a bias to either be bullish or bearish, how do I use this? Check this next article to answer that question (Coming Soon)
This e-book is available on Amazon : Buy Now
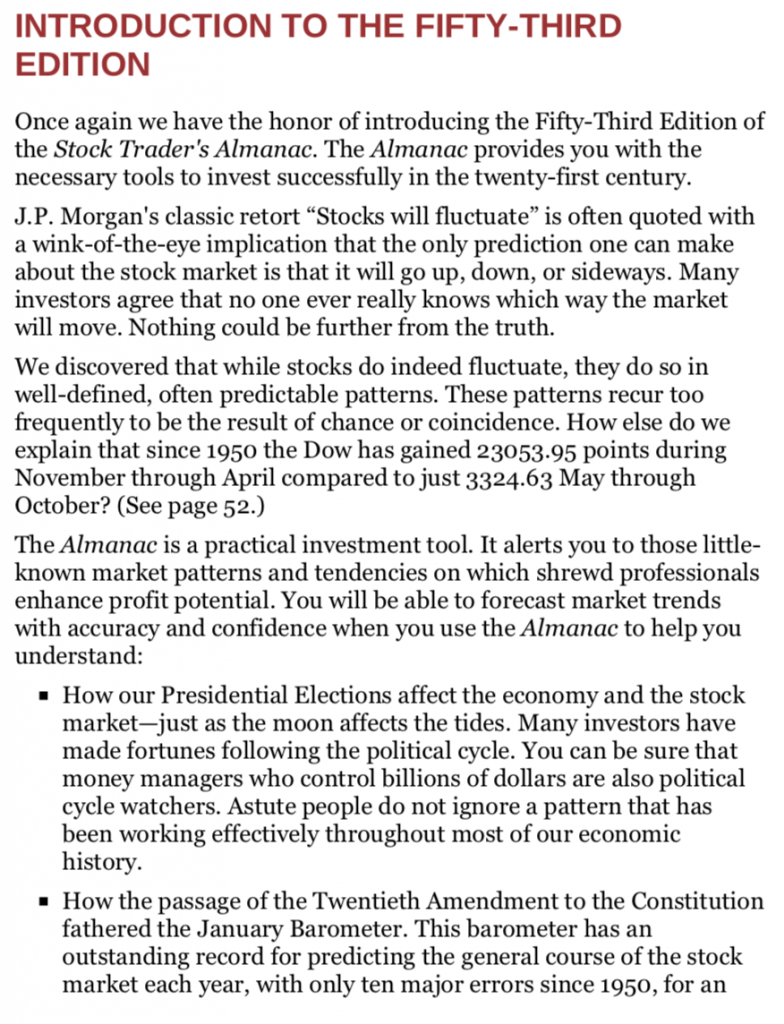
Here is the preview of what’s in the Traders Almanac 2020 book
Reference: https://stocktradersalmanac.com/

